Dating App Statistics by Race
Photo by Good Faces on Unsplash.
I used to think of dating apps as a giant, neutral mixing bowl: everyone shows up, everyone scrolls and the best matches simply show up at the top.
But the more I read into the numbers worldwide, and the more I’ve listened to people talk about their experiences, the more I’ve realised something uncomfortable: race and ethnicity do shape what you see, who sees you and how people respond sometimes in ways that are subtle, sometimes in ways that are painfully direct.
Looking at dating app statistics by race might seem controversial because it can sound like you’re trying to discriminate against certain groups of people. That’s not what I’m doing here! I’m looking at the numbers to understand patterns because patterns can reveal bias, and bias is easier to challenge when you can actually name it.
Below, I’m going to walk you through what the best-known datasets show, what they don’t show, and how I think you and I should interpret this stuff without turning dating into an ugly spreadsheet exercise.
Read on for more insights:
Do Different Racial Groups Use Dating Apps at Different Rates?
Reply Rates And Messaging: The OkCupid Numbers People Still Cite
A Key Dynamic: People Act More Open When The Other Person Goes First
A Global Note: “In-Group Preference” Varies Hugely by Country
Why These Stats Can Hurt, And How I Think You Should Read Them
What “Dating App Statistics by Race” Usually Measures
When people search this keyword, they’re typically after one or more of these:
Usage: who uses dating apps or dating sites by race/ethnicity
Behaviour: who messages whom, and who replies or matches
Stated preferences: who says they will or won’t date certain groups
Outcomes: who ends up dating outside their group, forming relationships, marrying, etc.
The frustrating part is that most modern apps keep the most revealing numbers private. So a lot of what we know comes from a mix of:
surveys (good for broad “who uses apps” questions),
academic studies (often based on a specific platform/time), and
a few moments in history where platforms themselves published internal data.
Do Different Racial Groups Use Dating Apps at Different Rates?
One of the most grounded answers comes from large, nationally representative surveys.
Pew Research Center’s survey of U.S. adults, fielded in July 2022, reported that 30% of U.S. adults had ever used a dating site or app, and there were no statistically significant differences in the share who had ever used online dating by race/ethnicity with similar shares across White, Black, Hispanic and Asian adults.
Another snapshot: SSRS (Feb 2024) found 37% of U.S. adults have used an online dating site or app at some point, and 7% were current users at the time of their January 2024 polling.
So if you’ve ever assumed that “this app is mostly one group” because of adoption, the survey evidence doesn’t strongly support that at least at the level of “who’s tried it.”
And yet… similar usage doesn’t mean similar experiences.
Source: Pew Research Center, SSRS
Reply Rates And Messaging: The OkCupid Numbers People Still Cite
Some of the most widely referenced dating app statistics based on race come from OkCupid’s old research blog, OkTrends. It’s dated mid-2000s/early 2010s, but it’s unusually specific about messaging and reply behaviour, which is exactly what people want when they search this topic.
In a 2009 post, OkCupid described analysing messaging and reply patterns and reported clear race-linked gaps in replies. For example, when discussing women’s reply behaviour to men, they noted that white women, Asian women, and Hispanic women replied to non-white men at lower rates citing figures such as 21.9% (Asian women), 22.9% (Hispanic women), and 23.0% (white women) replying to non-white men in their analysis.
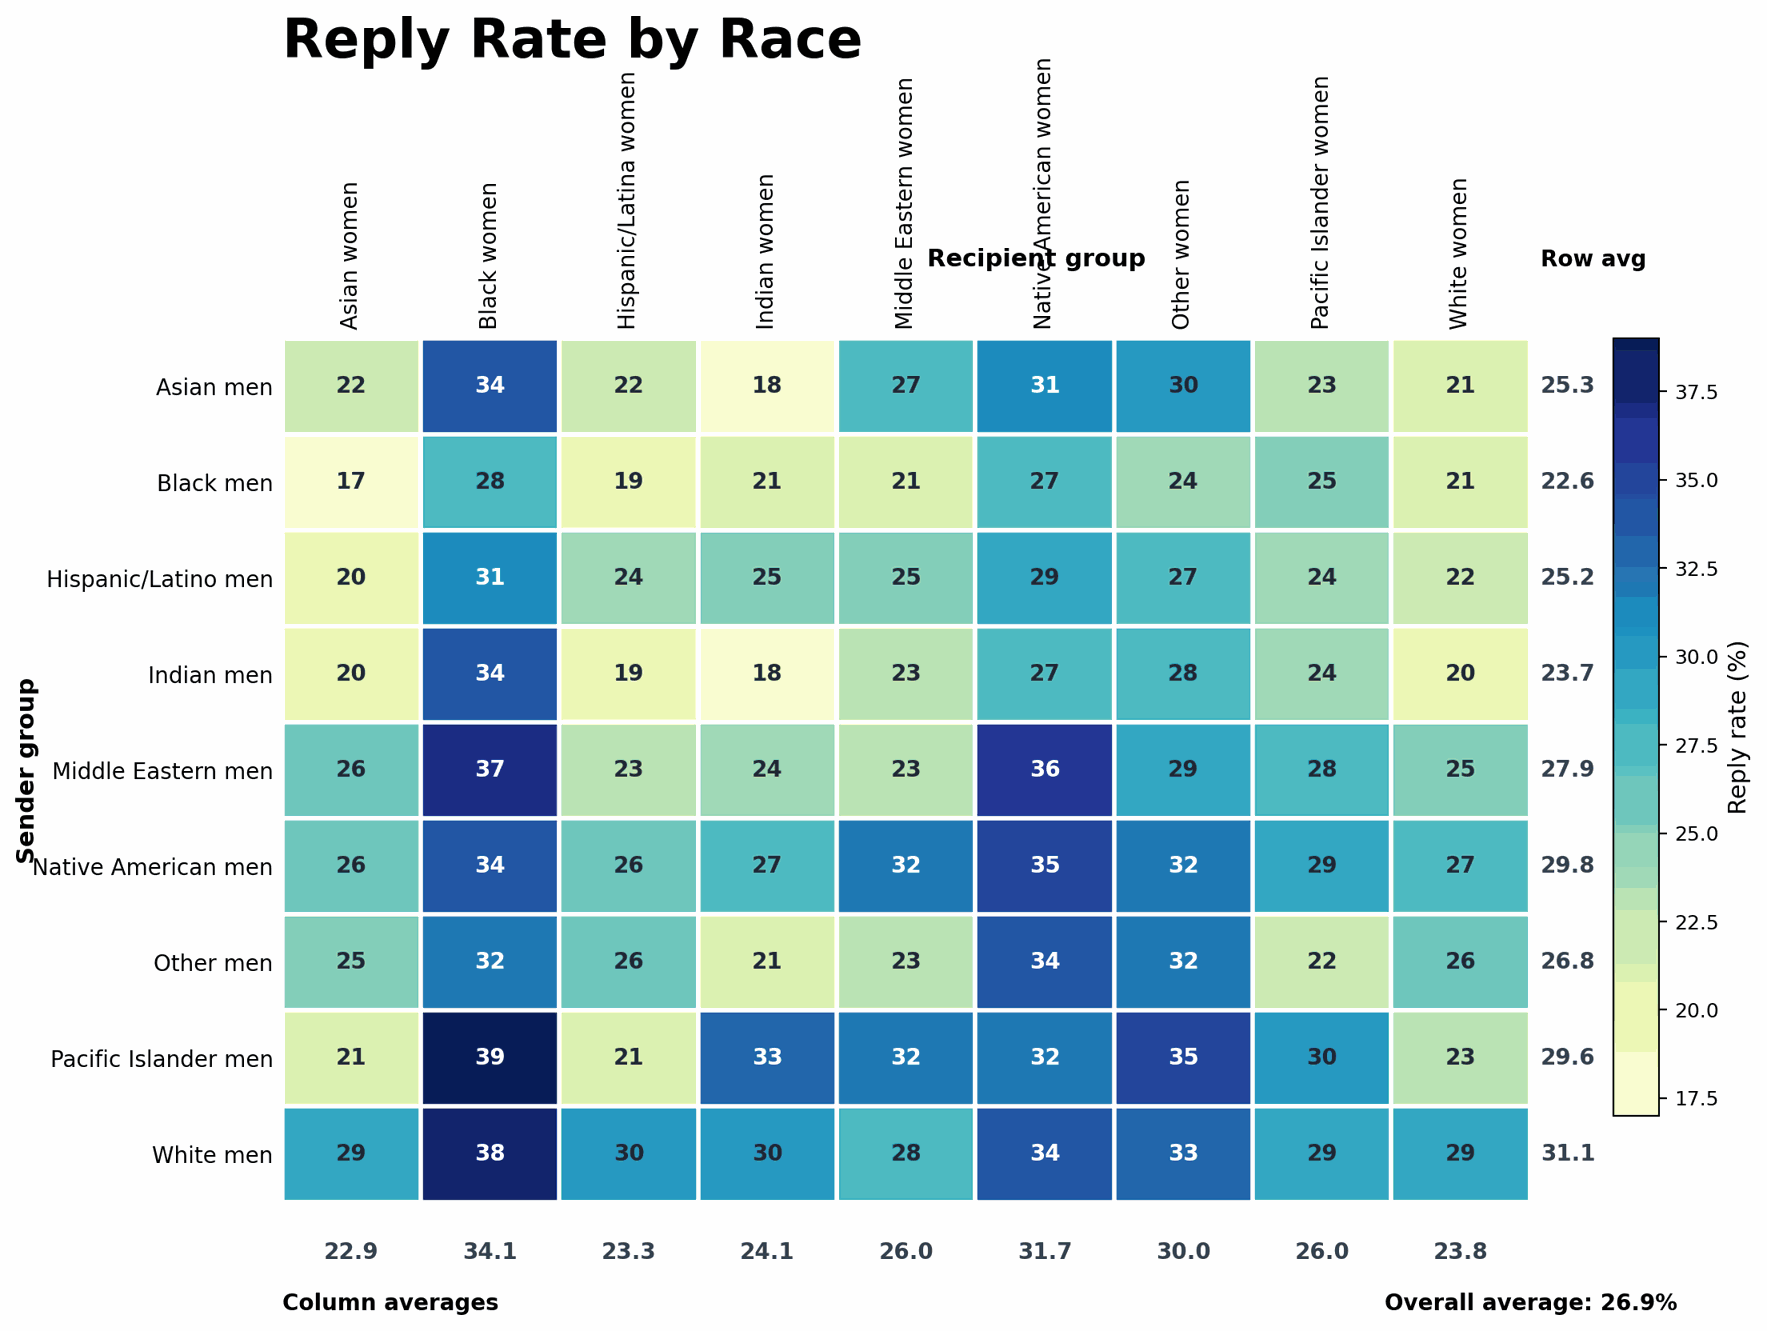
Reply rates by race for men messaging women; darker colors indicate higher response rates.
The same post also reported that black women replied the most to first-contact messages, while at the same time black women received far fewer replies than expected with the blog describing that men (including black men) replied to black women less often than to other groups.
OkCupid also claimed that in their “women messaging men” view of replies, white men had a lower overall reply rate than non-white men in that dataset giving figures like 40.5% (white men) vs 48.1% (non-white men).
When I read numbers like these, my first instinct is to ask: what are we really measuring here attraction, opportunity, confidence, fatigue, social scripts, or plain old bias? The honest answer is “some mixture of all of it”.
Still, these figures matter because they show the shape of inequality: not “who’s best”, but who faces friction at the point of first contact.
Source: Gwern
Stated Exclusions: Who Says “I Only Date My Own Group”?
Behaviour is one thing. Stated preferences are another and sometimes even more revealing, because they show where people draw hard lines.
A peer-reviewed paper in Social Forces (Robnett & Feliciano, 2011) analysed 6,070 U.S. heterosexual dating profiles and looked at who users said they were willing or unwilling to date by race/ethnicity. One striking set of findings amongst those who stated a preference was:
29% of white men and 65% of white women “prefer to date only whites” in their sample.
By contrast, only 15% of Latino men and 16% of Latina women “prefer to date only Latinos”.
The same paper also reported gendered patterns in exclusion. For example, it noted that 76% of black women excluded white men as possible dates in their sample, compared with 33% of Latinas and 11% of Asian women excluding white men.
There’s a temptation to weaponise stats like this (“see, group X is the problem”). I don’t think that’s fair or useful. What I see instead is a reminder that “preferences” are not created in a vacuum. They’re shaped by lived experience: how often you’re treated respectfully, fetishised, ignored, stereotyped or harassed.
If your experience on apps has taught you that contacting certain groups leads to humiliation or hostility, your “preference” might actually be a form of emotional self-protection. That doesn’t make the pattern painless, but it makes it more human.
Source: Social Forces
A Key Dynamic: People Act More Open When The Other Person Goes First
One of the most interesting ideas in this whole space is that a lot of “segregation” happens at the initiation stage not necessarily because people refuse cross-race connection in principle, but because they anticipate rejection.
A widely cited study by sociologist Kevin Lewis covered in a University of California, San Diego write-up republished by ScienceDaily, analysed interactions amongst 126,134 U.S. OkCupid users over roughly two and a half months, focusing on first messages and first replies (and on users identifying within major racial categories used on the platform).
The summary reported patterns like:
People largely initiated contact within their own race, mirroring offline patterns.
But people were more likely to reciprocate cross-race contact than older research might suggest.
The tendency to initiate within one’s group was described as strongest among Asians and Indians and weakest among whites in that dataset.
After replying to someone from another race, people became more likely to cross racial lines themselves though the effect was described as short-lived (about a week).
I find this oddly hopeful, even if it’s not a fair burden to place on anyone. It suggests that some walls are made of fear and habit as much as ideology and that small acts of openness can ripple outward.
Source: Science Daily
App Design Matters: Filters And Algorithms Can Amplify Bias
Even if every user were perfectly kind, the systems can still steer outcomes.
A WIRED report discussing research on the top-grossing dating apps in the U.S. described findings that, among 25 high-grossing apps, many collected race/ethnicity data and/or enabled filtering by ethnicity reporting figures like 19 apps requesting users’ race/ethnicity, 11 collecting preferred ethnicity, and 17 allowing filtering by ethnicity.
When you give people a race filter, you don’t just “reflect preferences” you make exclusion faster, cleaner, and easier to scale.
And even when apps don’t have explicit race filters, ranking systems can still reproduce inequality. A Harvard Gazette piece on sociologist Apryl Williams’ work argues that recommendation systems can reflect (and potentially entrench) stereotypes and biases, shaping who is shown to whom.
This is where the numbers stop being abstract and start feeling personal. Because if the deck you’re served is already skewed, then your “preferences” are partly being pre-selected for you.
Source: Wired, Harvard Gazette
A Global Note: “In-Group Preference” Varies Hugely by Country
It’s also worth saying out loud: you can’t universalise U.S.-centric findings to the whole world. While much of the published research focuses on the US, stats from the UK suggest similar patterns in usage and messaging behaviour, even if detailed racial breakdowns are rarely made public.
A cross-national analysis presented by researchers at Oxford (using data from an online dating platform across 24 countries) reported that the proportion of respondents desiring a partner of the same ethnicity varied massively ranging from under 20% in Chile to over 80% in Slovakia in their country-level view.
If you’ve ever wondered why your experience changes dramatically when you move cities (or countries), this kind of variation is a big part of the answer.
Source: PAA 2019
Why These Stats Can Hurt, And How I Think You Should Read Them
If you’re a person who sits in a group that gets fewer replies (or more fetishising messages), reading dating app statistics based on race can feel like watching someone quantify your dating life as a disadvantage. I don’t think it’s melodramatic to say that this can mess with your self-image.
So here’s how I try to keep my head straight:
1) These are platform-shaped patterns, not individual destiny
A percentage is a description of a dataset, not a prophecy about your future.
2) “Race effects” often hide other effects
Location, age, education, religion, language, photos, app culture, and who’s active at what times all of these change outcomes. Even the same platform can behave differently in different cities.
3) Categories are blunt instruments
Race and ethnicity labels vary by country and by platform. People are mixed, ambiguous, and complicated. The boxes rarely match real life.
4) The point of the numbers is accountability, not ranking
If a dataset shows that certain groups are systematically ignored, the ethical response isn’t “so they’re less desirable.” The ethical response is: why is this happening, and what would a fairer system look like?
What I’d Do With This Information If I Were Dating Today
I can’t control other people’s biases. You can’t either. But I do think you and I can refuse to let apps train our attraction into something narrower and crueller than it needs to be.
If you’re trying to date in a way that doesn’t reproduce the worst patterns in the stats:
Audit your own swipe habits. Not with guilt just with honesty. If your “type” maps perfectly onto a single race, it’s worth asking where that came from.
Be intentional about messaging. Some research suggests the biggest bottleneck is who initiates contact; being open in who you contact can matter.
Don’t use race filters (if the app offers them). They’re a shortcut that makes exclusion frictionless.
Protect your peace. If you’re dealing with racism, fetishisation, or repeated microaggressions, your boundaries are not “being picky” they’re self-respect. (The numbers don’t capture the emotional labour.)
And maybe the biggest one: remember that apps are not the whole dating market. They’re a very particular kind of social arena one that turns people into profiles, and profiles into split-second decisions.
Source: Science Daily, Wired, Harvard Gazette
The Bottom Line
Race-based dating app statistics don’t tell you who is lovable. They’re telling you how desire, bias, fear of rejection, and platform design collide in one of the most intimate corners of modern life.
The stats are real. The pain behind them is real too. But so is the possibility of acting differently of building a dating life that doesn’t let an algorithm (or a cultural stereotype) do your choosing for you.