Dating App Statistics by Gender
I hear this every week from the men I coach. One comes in frustrated because he can't get a single reply. An hour later, a woman tells me she's burnt out from filtering 200 messages. Same app, but completely different story.
And if you've ever stared at your phone wondering why nobody seems interested, the numbers offer an answer.
That’s why knowing gender-based dating app statistics matters: it shows the struggle of the pool you’re in.
What Do Dating App Statistics by Gender Show About User Demographics?
Dating apps have an uneven user base. Understanding dating app demographics by gender provides important context for everything from match rates to user behaviour.
What does the UK data look like?
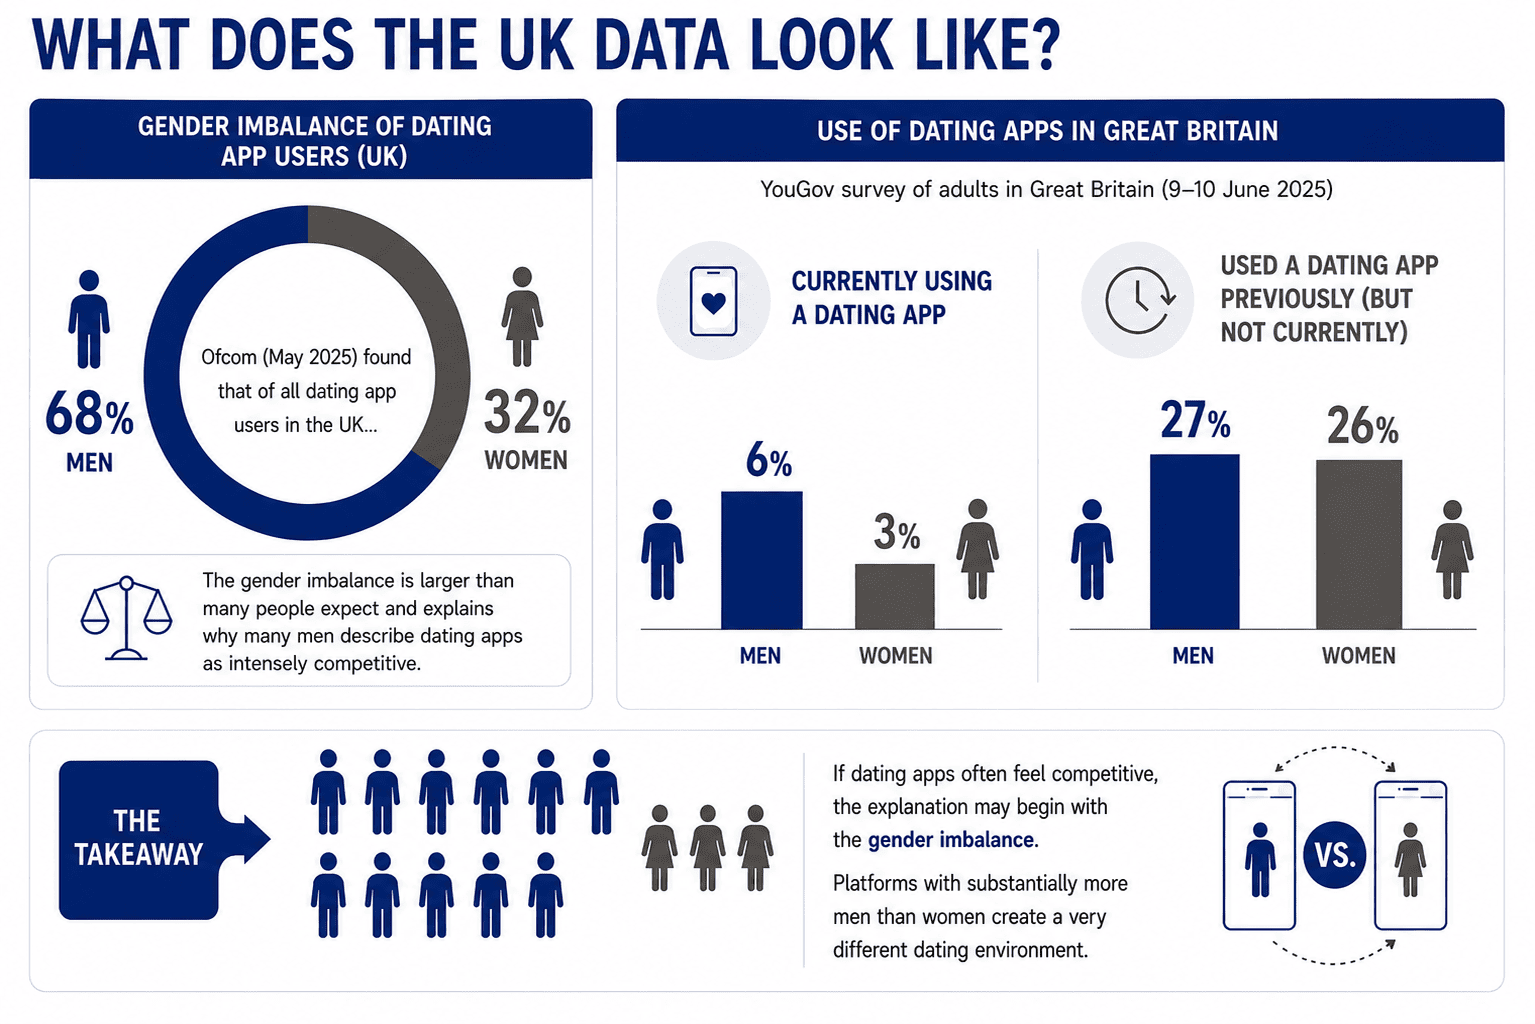
Most people assume online dating platforms are an even playing field. The numbers suggest otherwise. Ofcom's May 2025 data found 68% of dating app users were men, compared with 32% women.
A YouGov survey of adults in Great Britain (fieldwork 9–10 June 2025) found:
6% of men said they were currently using a dating app vs 3% of women
27% of men said they’d used one previously (but not currently) vs 26% of women
What does the UK dating app data look like?
If dating apps often feel competitive, the explanation may begin with the gender imbalance. Platforms with substantially more men than women create a more competitive environment.
Source: YouGov Survey 2025, Ofcom
Is the US any different?
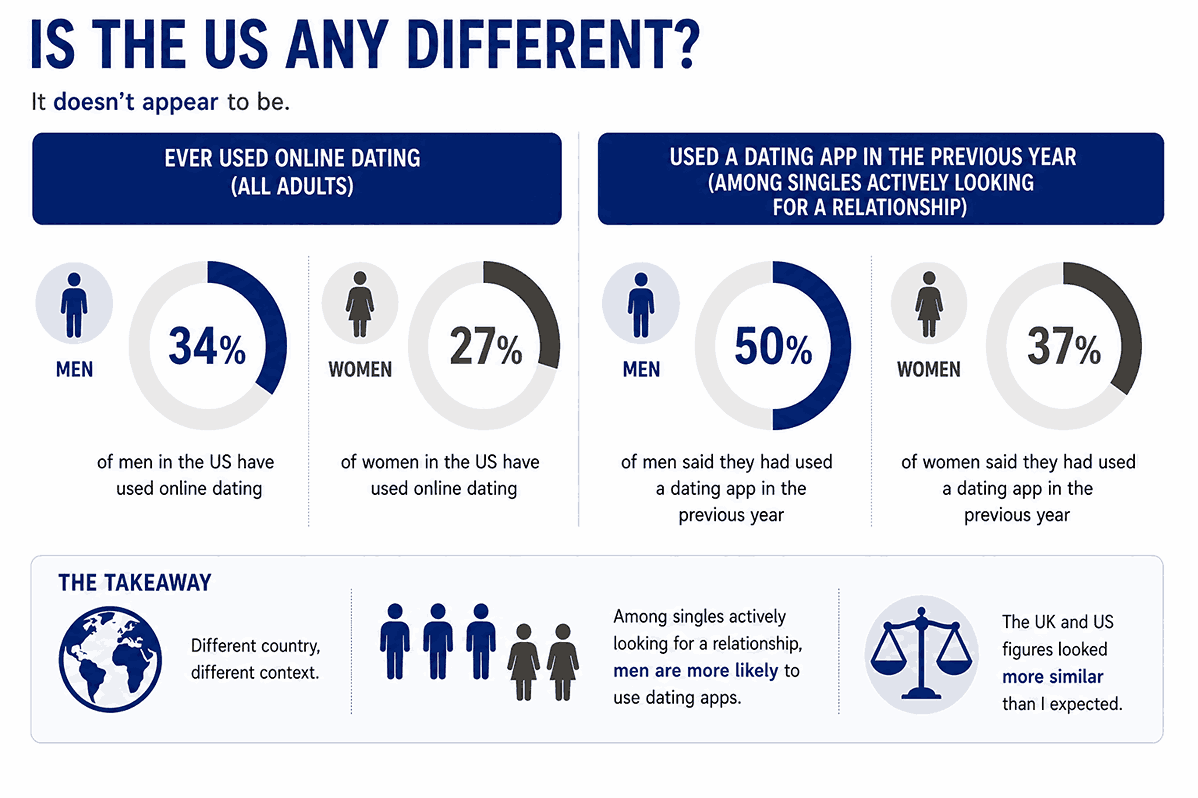
The obvious question is whether this is a UK-specific phenomenon. It doesn't appear to be. Pew Research Center found 34% of men in the US had used online dating, compared with 27% of women.
Amongst singles actively seeking a committed romantic relationship, the gap widens. Half of men said they had used a dating app in the previous year, compared with 37% of women.
What are the dating app statistics by gender in the US?
The UK and US figures looked more similar than I expected. When reviewing gender differences in dating app usage, one trend appears consistently: men tend to adopt online dating slightly more often than women.
New country, same story, but the “men slightly ahead on adoption” pattern lines up with what we often see elsewhere too.
Source: Pew Research Center
Does the pattern hold amongst LGBTQ+ users?
I expected the gap to disappear amongst LGBTQ+ users, but the data suggests otherwise.
Amongst LGBTQ+ adults, Pew found 57% of LGBTQ men have used online dating, compared with 46% of LGBTQ women.
This isn't a straight-dating problem. The imbalance follows the app, not the orientation.
Source: Pew Research Center
Which Dating Apps Have the Most Men and Women?
One of the most practical things I tell the men I coach is this: dating app stats based on gender don't describe a single market. Each app has its own gender imbalance, and if you're a straight man, choosing the wrong platform can make dating considerably harder before your profile even enters the equation.
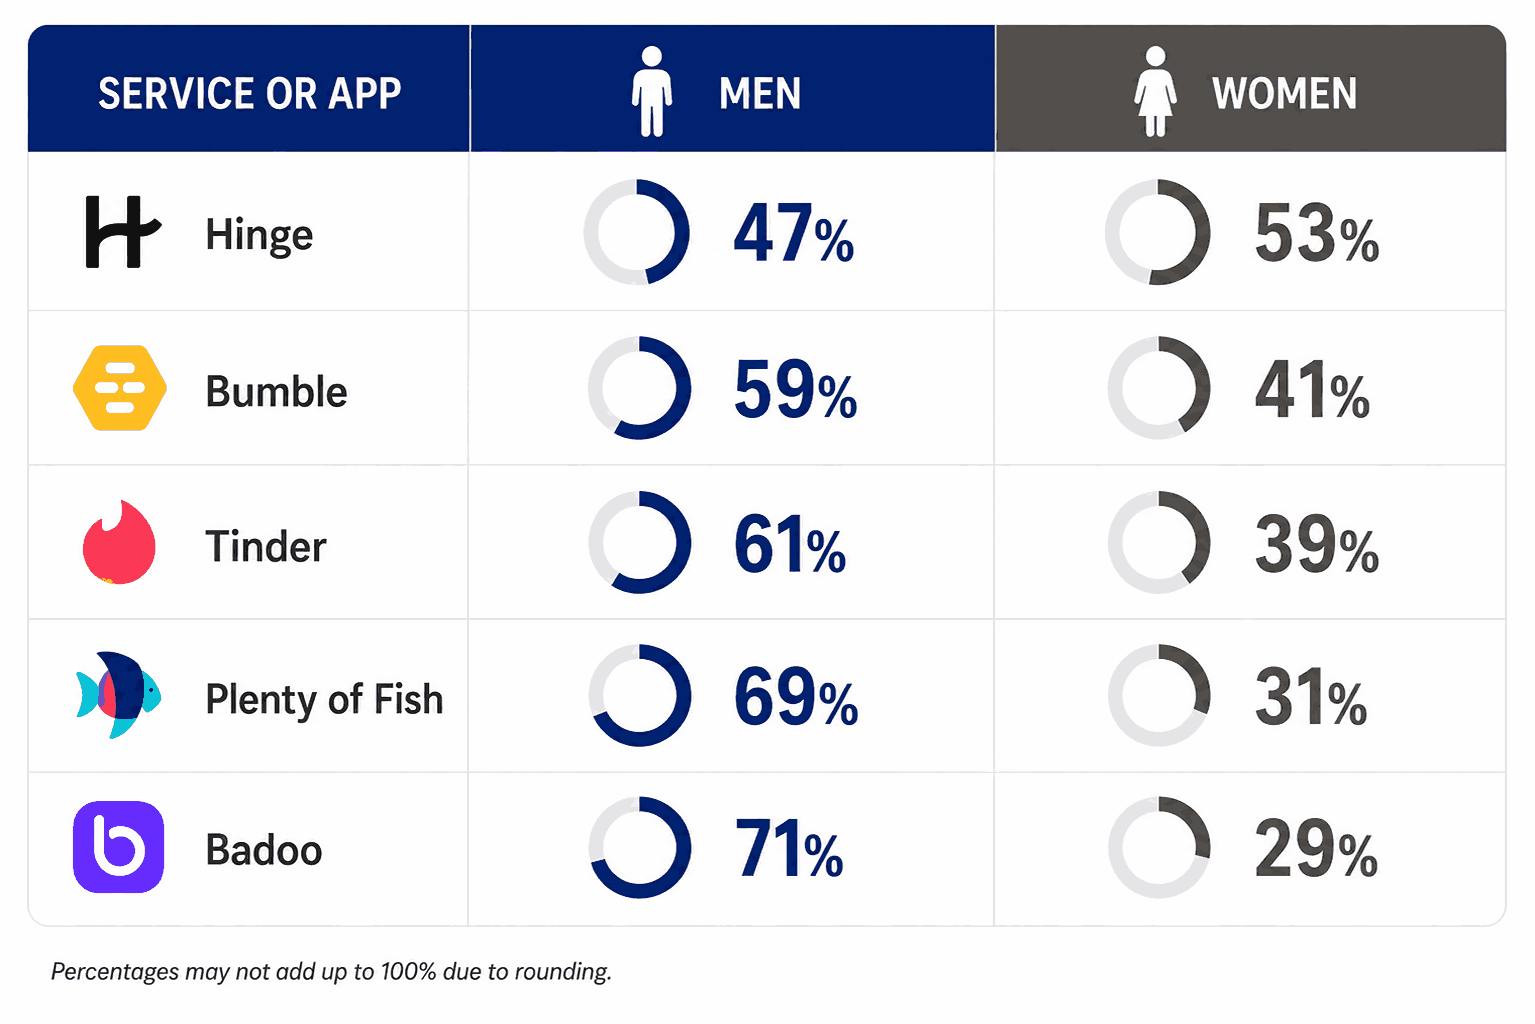
Ofcom’s audience composition data for May 2024 shows how different the gender split can look depending on the app.
Which dating apps have the most men and women?
If you're getting poor results on a heavily male-skewed app, the first question isn't "what's wrong with my profile?" It's "am I competing in the toughest room I could possibly have chosen?" Sometimes switching apps or preferring face-to-face interactions is the smartest move you can make.
Source: Ofcom
Who Gets More Matches, Messages, and Dates on Dating Sites?
Who usually starts the conversation?
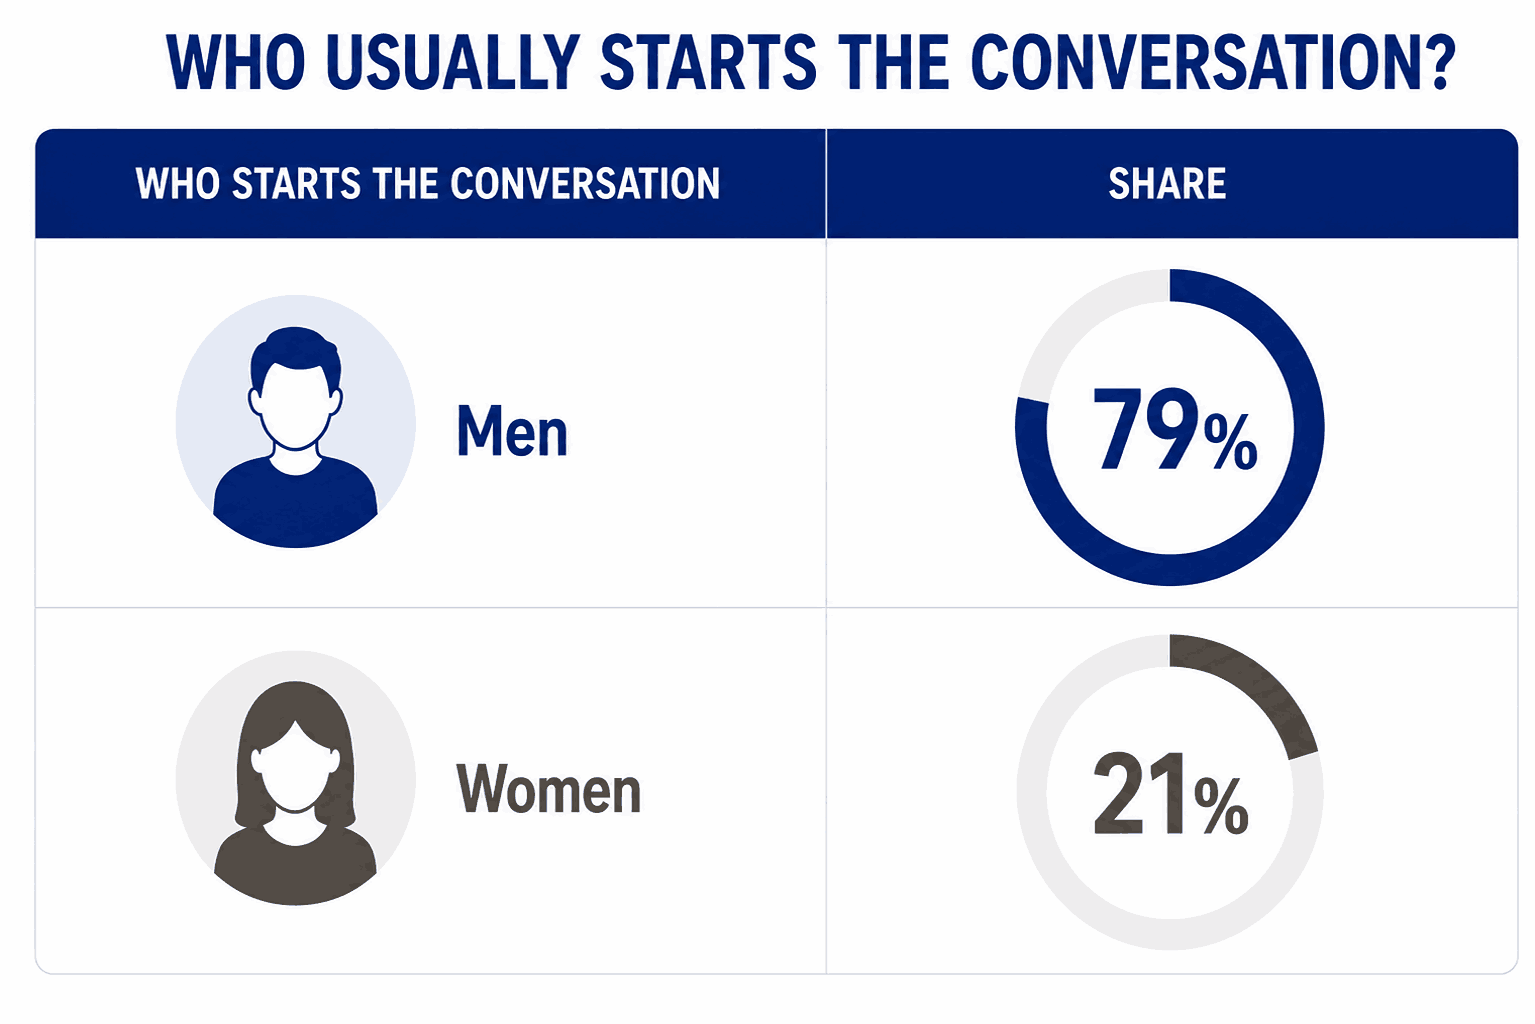
In every session I run, I get asked: "Should I wait or message first?" Men initiated 79% of first messages across more than two million interactions studied. If you're waiting to be found, you are in the minority of a minority.
Most guys I see waste energy resenting this. Those who do well accept it and pour their energy into their approach instead.
Who usually starts the conversation on dating apps?
This doesn’t mean women “should” or “shouldn’t” message first, but it does explain why so many men experience dating platforms as a job application process, while so many women experience it as inbox triage.
Source: Oxford Internet Institute
What is the response rate by gender?
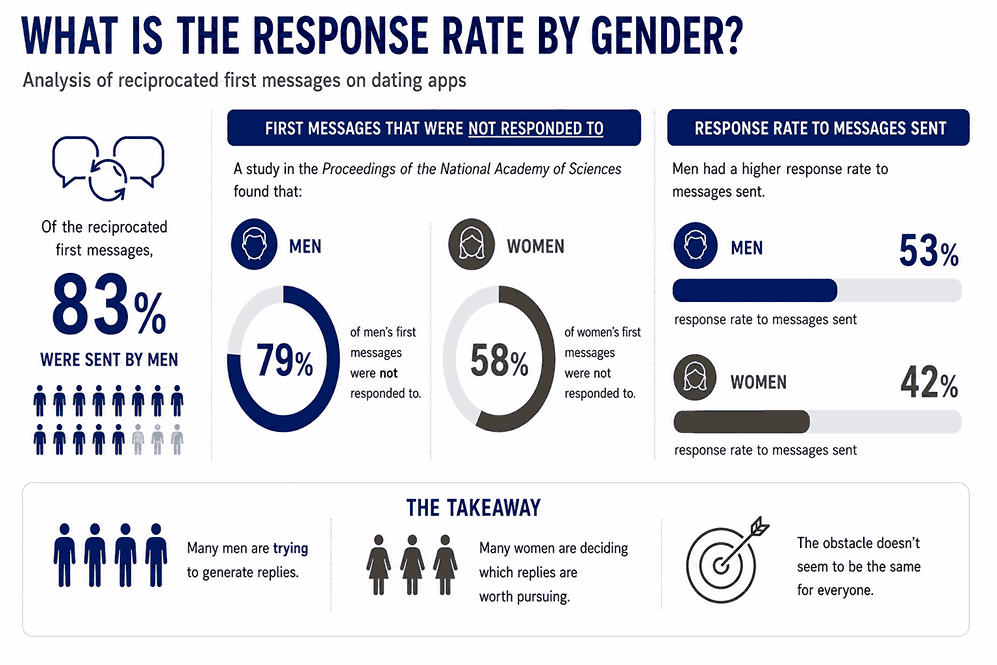
Of the reciprocated first messages, 83% were sent by men.
Getting a reply is often the bigger challenge. A study in the Proceedings of the National Academy of Sciences determined 79% of men's first messages and 58% of women's first messages were not responded to. Men had a response rate of 53% to messages sent, while the rate was only 42% for women.
What is the response rate by gender on dating apps?
One thing I notice repeatedly is how easy it is to interpret silence as a verdict on your worth. Men had a response rate of 53% even to messages sent, meaning almost half go unanswered by default, regardless of who sent them. If your opener fails to land, don’t ask “what’s wrong with me?”, ask "is my opener doing any work at all?"
Source: Oxford Internet Institute, Proceedings of the National Academy of Sciences
Why Do Men and Women Use Dating Apps?
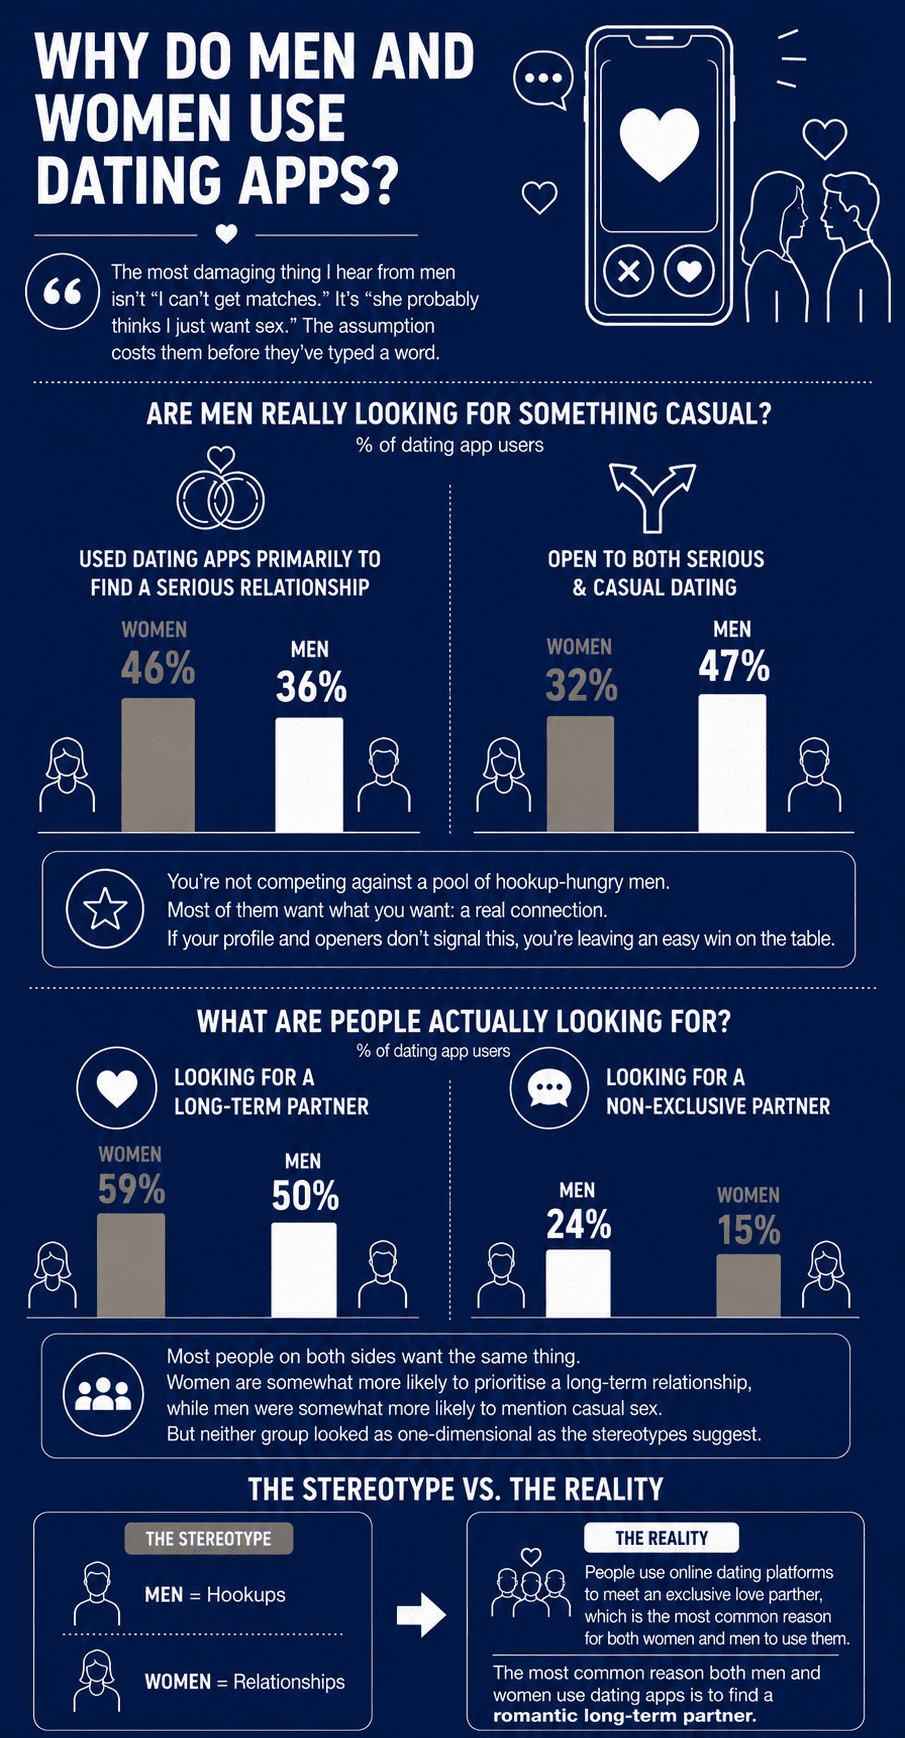
The most damaging thing I hear from men isn't "I can't get matches." It's "she probably thinks I just want sex." The assumption costs them before they've typed a word.
Are men really looking for something casual?
An SSRS survey found 46% of women used dating apps primarily to find a serious relationship, compared with 36% of men. Men were more likely to be open to both serious and casual dating, with 47% selecting the option, compared with 32% of women.
But here's what I tell every man: you’re not competing against a pool of hookup-hungry men. Most of them want what you want: a real connection. Which means if your profile and openers don't signal this, you're leaving an easy win on the table.
Source: SSRS
What are people actually looking for?
Most people on both sides want the same thing.
Women were somewhat more likely to prioritise a long-term relationship, while men were somewhat more likely to mention casual sex.
But neither group looked as one-dimensional as the stereotypes suggest.
Why do men and women use dating apps?
Source: Statista, University of Liverpool
The stereotype vs the reality
The internet talks as if men want hookups and women want relationships. The data tells a less dramatic story.
People use online dating platforms to meet an exclusive love partner, which is the most common reason for both women and men to use them. 59% of women and 50% of men reported they have used dating apps to find a romantic long-term partner.
24% of men reported using apps to find a non-exclusive partner, compared with 15% of women.
For both groups, the most frequent response was to find a committed relationship.
Source: Statista
How Much Do Men and Women Spend on Dating Apps?
Paying to find love is, of course, not new. Dating apps have simply given the adult population more ways to do it.
Who pays for dating apps?
CNBC found 41% of men pay for dating apps, compared with 29% of women. I've had clients spend a lot every month on boosts and still wonder why nothing's improving. Paying for visibility only works if your profile is worth being visible.

Who pays more on dating apps?
Before you upgrade, ask yourself honestly: if a woman lands on my profile right now, does it give her a reason to stop scrolling?
Source: CNBC
How much do dating apps cost?
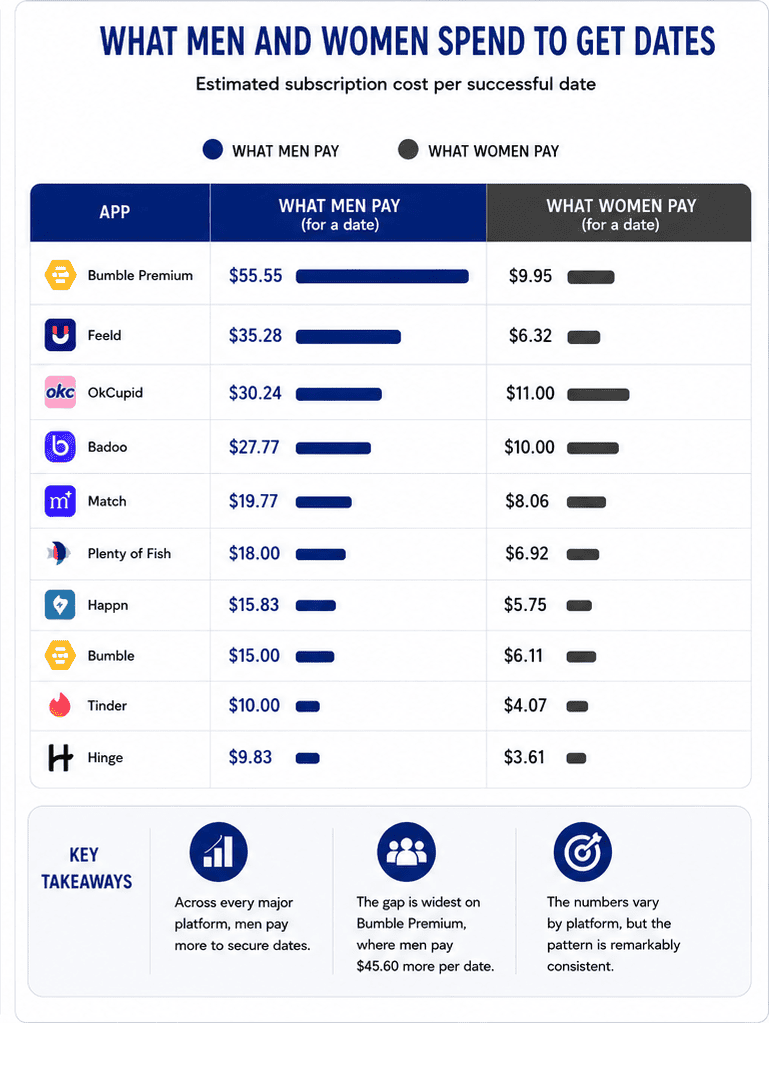
A study of more than 1,000 U.S. adults by Self Financial found the average person spends $58.84 per date. Men spent $67.87 on average, around 20% more than women.
The spending gap becomes even more noticeable when you look at dating app subscriptions.
A PlayersTime analysis estimated that men on Bumble Premium spend about $55.55 to secure a single date, compared with $9.95 for women. Same price. Completely different return on investment.
What do men and women spend to get dates?
The numbers vary by platform, but the trend is remarkably consistent. The spending gap starts to make more sense once you look at the incentives. Men who feel invisible are willing to pay more.
Source: Global Dating Insights, PlayersTime
Why are men more willing to pay?
Dating apps sell hope. And the less you're getting, the more you'll pay for it. I've never once heard anyone saying a boost fixed a profile that wasn't working. It amplifies what's already there. If what's already there fails to appeal, you're just paying to be ignored faster.
Source: Global Dating Insights
What Challenges Do Men and Women Face on Dating Apps?
So far, we've looked at matches, messages, money, and motivations. The next question is what the overall experience feels like once people start using these apps day after day.
Why do dating apps feel so different for men and women?
Worldwide, 75% of Tinder users are men and 25% are women. Once you see the gender imbalance, many common complaints become easier to understand.
In fact, 54% of women reported feeling overwhelmed by the number of messages they received on dating apps over the last year. Only 25% of men said the same.
Both sides can be miserable at the same time, but for opposite reasons.

Why do dating apps feel so different for men and women?
Source: Business of Apps, Pew Research Center
Do dating apps leave people feeling burnt out?
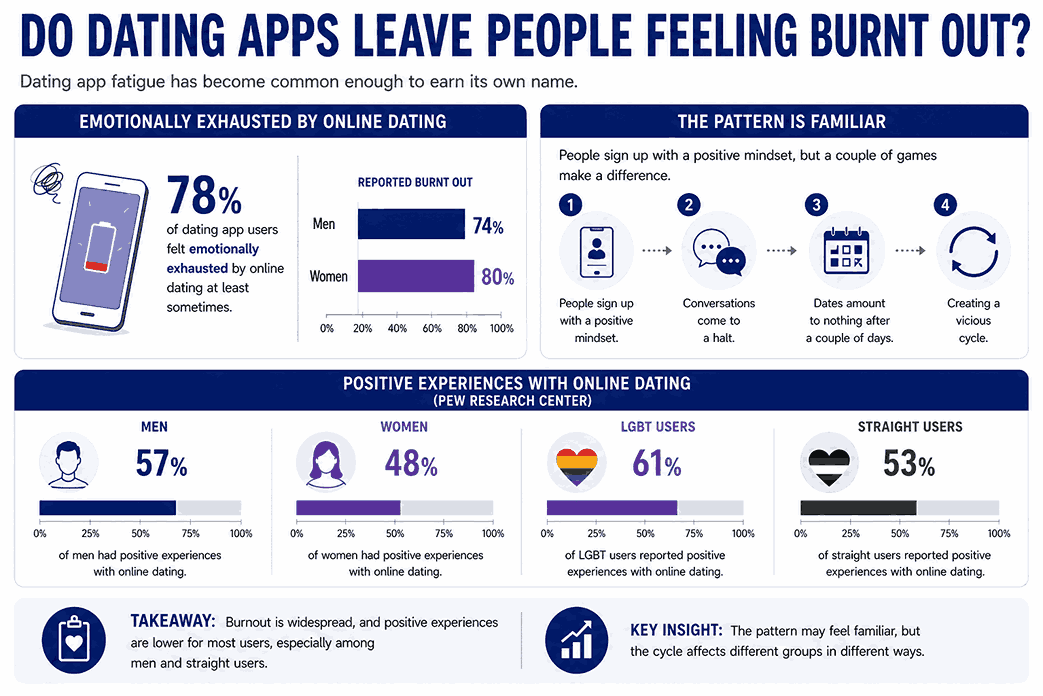
Yes, and most men suffer through it quietly. A survey by Mentor Research Institute found 78% of dating app users felt emotionally exhausted by online dating at least sometimes. Burnout was reported by 74% of men and 80% of women.
I see the same in my sessions constantly. Men who joined with genuine optimism, sent hundreds of messages, got nowhere, and quietly concluded the whole thing was pointless. It rarely is, but it does require a rethink of strategy rather than more of the same.
Pew showed 57% of men and 48% of women had positive personal experiences with online dating. Amongst LGBTQ users, 61% reported positive experiences, compared with 53% of straight users.
Do dating apps leave people feeling burnt out?
Source: Mentor Research Institute, Pew Research Center
What frustrates men the most?
For many men, the challenge begins long before a conversation starts.
Pew found that 64% of men who use dating sites felt insecure about the number of matches and messages they received.
Those numbers explain why paid boosts, premium subscriptions, and visibility remain popular amongst men.
Source: Pew Research Center
What frustrates women the most?
Women tend to report a separate issue. Rather than a lack of attention, many describe sorting through large numbers of matches while trying to find compatible partners. Pew Research found a noticeable gap here. Around half of women (51%) described their experiences on dating apps as negative, compared with 42% of men.
Getting matches is not always the same as finding someone worth meeting.

What frustrates men and women on dating apps?
Source: Pew Research Center
How Do Safety Concerns Differ Between Men and Women?
This is one area where I ask the men to genuinely step back and look at someone else's experience for a moment.
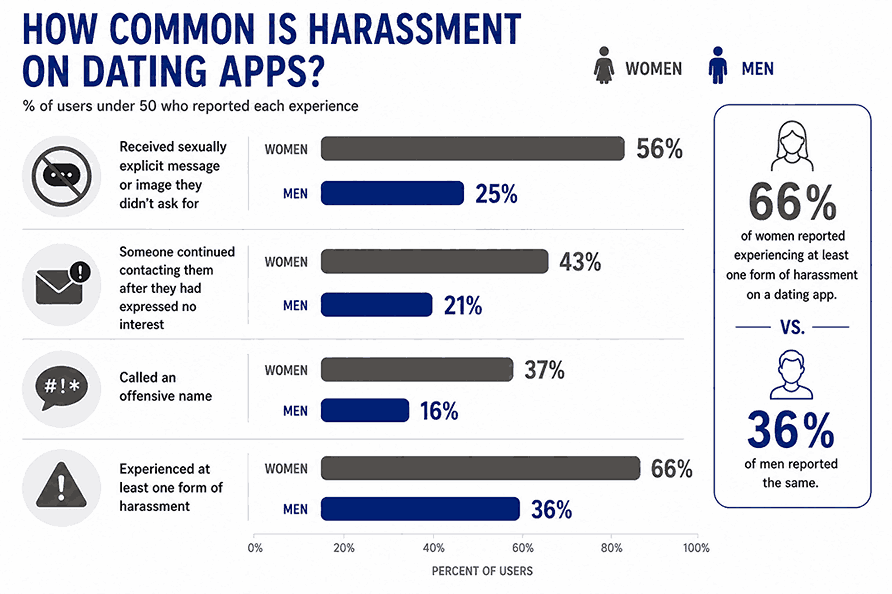
How common is harassment on dating apps?
Women often receive more messages on dating apps. A larger share of those messages are unwanted.
Pew found:
56% of women under 50 had received a sexually explicit message or image they didn't ask for.
Only 25% of men received similar messages.
Another 43% of women and 21% of men said someone continued contacting them after they had expressed no interest.
37% of women reported being called an offensive name.
Overall, 66% had experienced at least one form of harassment on a dating app, compared with 36% of men.
How common is harassment on dating apps?
If you’re a woman reading online dating statistics by gender and thinking, “Yes, and that’s why I’m picky,” I get it. And if you’re a man reading them and thinking, “I didn’t realise it was common,” this is exactly why dating app statistics by gender matter: they reveal the reality that different people are navigating. Pew also found women were more likely than men to say online dating is not very or not at all safe.
Source: Pew Research Center
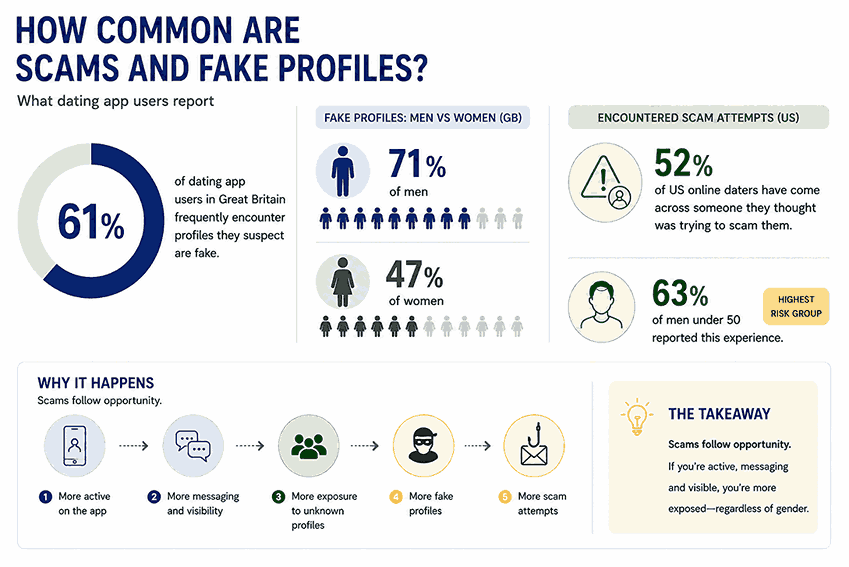
How common are scams and fake profiles?
In a YouGov poll of current dating app users in Great Britain (Dec 2023), 61% said they frequently encounter profiles they suspect are fake, and men were more likely than women to say so:
71% of men vs 47% of women.
Meanwhile, Pew found that 52% of US online daters said they’d come across someone they thought was trying to scam them, with men under age group 50 especially likely to report that experience (63%).
How common are scams and fake profiles?
My read on this is simple: scams follow opportunity. If you’re active, messaging, and visible, you’re more exposed, and this doesn’t map neatly onto one gender.
Source: YouGov Poll
The Bottom Line
The statistics don't tell us everything about dating, but they do explain why so many conversations about dating apps seem to talk past each other. Men and women often experience the same platforms under very different conditions. The latest dating app gender statistics and gender differences in dating app usage show many frustrations stem from structural realities rather than individual shortcomings.
Looking at the numbers made me more sympathetic to both sides.
Men face intense competition and low response rates. Women face message overload, harassment, and safety concerns.
Sometimes the most empowering move is changing your strategy, your app, or your expectations to fit the reality of the pool you're actually in.